China Research Trip: 2019
Last month we visited China. Every visit brings new insights and helps build our knowledge around two primary considerations. Firstly, we try to gauge the demand for commodities and the flow on effect to the Resources exposure in the portfolios. Secondly, we continue to build our understanding of the broader Chinese economic model. As always after every trip, we learn more with more questions being raised about the edifice that is modern day China.
Our key findings from this trip:
- Despite some short-term headwinds, we think China is likely to remain on course this year to achieve their GDP target of 6.0-6.5%. Vulnerabilities are increasing due to the sheer size and increasing cyclicality of the economy. The shift to a consumer-led economy over the medium term remains a key policy goal for the government.
- Metal intensity of GDP/Industrial Production has fallen sharply – commodity demand remains stable, but growth is low single digits at best, well below the level of GDP. Further stimulus in the property sector will be the swing factor for demand in 2019.
- Environmental control was loosened in 2018 because of a weaker economy. Compliance with standards in 2019 will depend on the state of the economy.
- Government sponsored growth of big state-owned enterprises (SOE) appears to be on hold. Large tax/VAT cuts for corporates as well as directing policy banks to lend to small to medium-sized enterprises (SME) shows that the government is trying to stimulate private business. This is a big positive, as the private sector drives employment growth.
- There remains a large opportunity for Australia to increase its exposure to those sectors of the Chinese economy that are more consumer orientated – education, healthcare, tourism, food etc.
The US trade deal and the impact on the economy
A resolution to the trade deal is a necessary condition to stabilising the economy. The longer the trade deal lingers, the greater the negative impact. There is consensus on the ground that it’s likely a deal will get done. The front loading of exports in 2018 before the tariffs were enforced will mean that trade data will remain soft till the middle of this year.
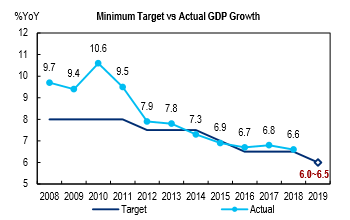
Despite that, there is a strong sense the 6.0-6.5% GDP growth target this year will be achieved, driven by fiscal and monetary support aimed at the private sector. Corporate VAT and related tax reductions along with personal tax cuts is a clear signal that the government is looking to stimulate consumption. The large policy banks have been encouraged to lend to SMEs. Leverage in the economy fell 6% in 2018, mainly through constricting the shadow banking sector. The growth targets set are needed for the central government to focus on job creation. We expect GDP growth within the stated target range to generate 13 million jobs, similar to 2018.
Chart 1: Minimum Target vs Actual GDP Growth
Source: GWR, NBS and Citi Research, March 2019.
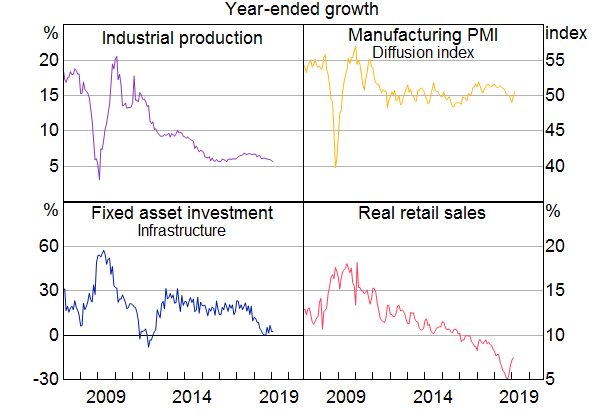
Chart 2: China – Activity Indicators
Sources: CEIC Data, Markit, RBA, March 2019
Demand for Commodities
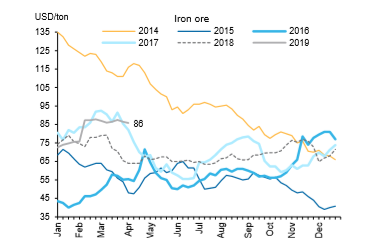
Chart 3: Iron Ore
Source: Bloomberg, Macquarie Macro Strategy, April 2019
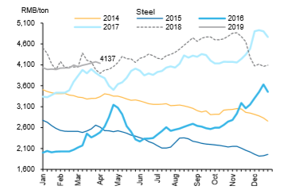
Chart 4: Steel
Source: Bloomberg, Macquarie Macro Strategy, April 2019
Over the last few years China has represented at least half of global demand for steel, copper, and aluminium. Demand over the next 12 months is likely to remain steady. The most interesting takeaway is the demand for all these metals is growing at significantly lower multiples of GDP growth or IP growth. Reports by the China Iron and Steel Association, along with company management meetings conducted, indicate that is steel is growing at -2/+2%, Copper is growing at 2-4% and Aluminium around the 3-4% level. On the face of it this means that if the demand from China is indeed stable, it is unlikely to see any major uptick in commodity demand. However, because the base of Chinese consumption is so large, small changes to global supply or demand will still have quite a big influence on the overall demand/supply balance – as witnessed by the impact from the recent Vale dam failure incident in the iron ore market.
Liquefied natural gas (LNG) demand in China has grown significantly in the last two years because of the government commitment on ‘coal to gas substitution’. The lax enforcement of environmental standards this last winter (2018/9) meant that the overall demand for gas through the Chinese winter was less than expected and this, combined with much higher supply, has resulted in spot LNG prices trading below US$5/mmbtu. The likely completion of the Russian “Power of Siberia” pipeline later this year will be a dampener on LNG demand and needs to be watched.
Infrastructure
Infrastructure spending has traditionally underpinned the demand for commodities and has been the government’s favoured tool for economic stability.
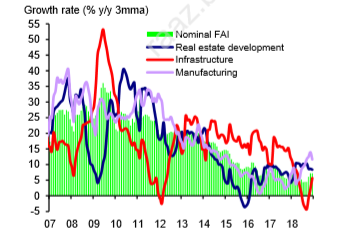
Although infrastructure spending is expected to grow ~10% in 2019, the composition of this spending is changing. For example, the rollout of 5G and industrial internet projects are less commodity intensive and hence commodity demand will not keep pace with infrastructure fixed asset investment (FAI) going forward.
Chart 5: Infrastructure FAI growth to pick up to 10% in 2019
Source: CEIC, UBS estimates, March 2019
Property
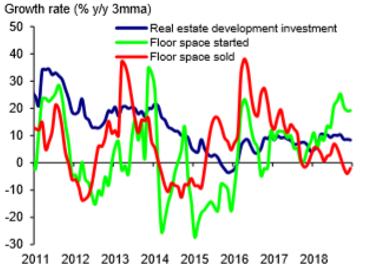
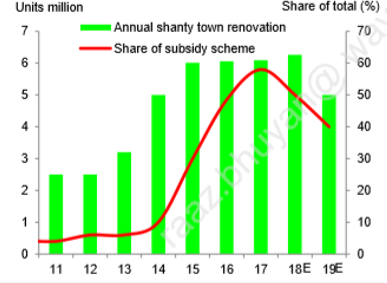
Expectations around property prices are currently muted. Whilst property demand in Tier 1/2 cities is improving, this comprised less than 20% of the country’s construction volume (the driver of commodity demand). Residential construction in Tier 3/4 cities is expected to slow with housing starts likely to grow between -5-0% this year. The government has had a significant influence in property demand in Tier 3/4 cities because of their shanty town redevelopment program. This represented 15% of the total starts in the last two years. We see this as not dissimilar to infrastructure spending – used as a stabiliser for the economy. Property has a more direct multiplier short term – so our expectation should be that the central government will continue to support the property sector, especially if the trade deal is delayed. This sector can certainly surprise on the positive side.
Chart 6: Shanty town renovation to slow pace and subsidy scheme to fade in 2019…
Source: CEIC, UBS estimates, March 2019
Chart 7: …leading to 4-6% decline in China’s property sales volume in 2019
Source: CEIC, UBS estimates, March 2019
There was renewed speculation of the introduction of a property tax. Ever since President Xi talked about “home being for living and not for speculation”, the government raised the spectre of a property tax to control speculative investing. In the absence of alternatives, property remains the key investment area for Chinese nationals.
Environmental standards
Enforcement of environmental standards were not as strict through the 2018/19 winter as the government was conscious of a possible adverse impact on activity levels in the economy. In the ‘2+26 cities’ identified for stricter environmental controls, companies that have installed ultra-low emission equipment have been given preferential treatment by the local authorities who are now charged with improving compliance. The recent explosion in a chemical plant in Yancheng (300km north of Shanghai) that killed 47 people may force the government to become more stringent.
What this all means for the WaveStone portfolios
WaveStone’s current investments across the Resources sector has been confined to BHP, Rio Tinto (RIO) and Alumina (AWC) in materials and Woodside Petroleum (WPL) and Oil Search (OSH) in energy.
Our investment in the large miners is predicated on their low cost, long life assets. We like iron ore as a commodity because of the industry structure and attractive returns (with four players dominating the seaborne market). The recent mantra of the big miners of ‘value over volume’ has resonated with investors, meaning a rational price setting. Board and management focus on capital allocation has meant that the strong operating cash flows have been streamed back to shareholders in the form of buybacks and dividends. The recent tailings dam incident in Brazil means that the iron ore market will be in deficit this year – prolonging the higher cash generation for a bit longer. The valuations now are full and our overall holdings have reduced, especially RIO. We’ve preferred BHP over RIO because of their commodity diversity and better options for growth.
Whilst our long-term thesis on LNG remains that demand will be driven from coal to gas substitution in the key Asian markets, we note there are short-term oversupply issues after a number of recent project start-ups and this is expected to weigh on spot LNG prices over the next 12 months. While this might be negative for sentiment, both our investments, WPL and OSH, have most of their LNG contracted over the medium to long term in oil-linked contracts which protects their cash flows from the vagaries of the spot market. Both these companies are embarking on large projects which should provide substantial longer-term production and earnings growth, but we will balance this optimism with the risks attached to potential project overruns and/or delays.
Author: Raaz Bhuyan, Principal and Portfolio Manager


